layout
Change layout of graph plot
Description
layout( changes
the layout of graph plot H)H by using an automatic
choice of layout method based on the structure of the graph. The layout function
modifies the XData and YData properties
of H.
layout( uses
additional options specified by one or more Name-Value pair arguments.
For example, H,method,Name,Value)layout(H,'force','Iterations',N) specifies
the number of iterations to use in computing the force layout, and layout(H,'layered','Sources',S) uses
a layered layout with source nodes S included in
the first layer.
Examples
Graph Layout Based on Structure
Create and plot a graph using the 'force' layout.
s = [1 1 1 1 1 6 6 6 6 6];
t = [2 3 4 5 6 7 8 9 10 11];
G = graph(s,t);
h = plot(G,'Layout','force');
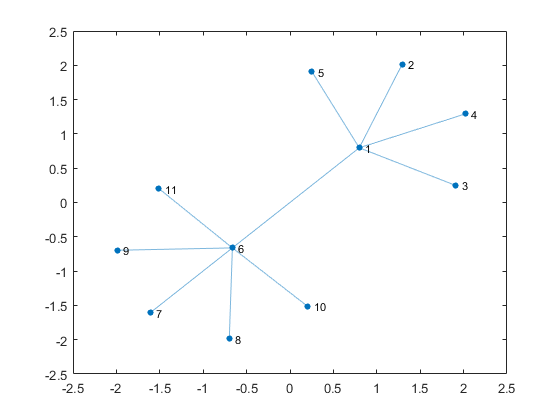
Change the layout to be the default that plot determines based on the structure and properties of the graph. The result is the same as using plot(G).
layout(h)

Change Layout of Graph
Create and plot a graph using the 'layered' layout.
s = [1 1 1 2 2 3 3 4 5 5 6 7];
t = [2 4 5 3 6 4 7 8 6 8 7 8];
G = graph(s,t);
h = plot(G,'Layout','layered');

Change the layout of the graph to use the 'subspace' method.
layout(h,'subspace')

Refine Layout Method of Graph
Create and plot a graph using the 'layered' layout method.
s = [1 1 1 2 3 3 3 4 4];
t = [2 4 5 6 2 4 7 8 1];
G = digraph(s,t);
h = plot(G,'Layout','layered');

Use the layout function to refine the hierarchical layout by specifying source nodes and a horizontal orientation.
layout(h,'layered','Direction','right','Sources',[1 4])

Input Arguments
More About
References
[1] Fruchterman, T., and E. Reingold,. "Graph Drawing by Force-directed Placement." Software — Practice & Experience. Vol. 21 (11), 1991, pp. 1129–1164.
[2] Gansner, E., E. Koutsofios, S. North, and K.-P Vo. "A Technique for Drawing Directed Graphs." IEEE Transactions on Software Engineering. Vol.19, 1993, pp. 214–230.
[3] Barth, W., M. Juenger, and P. Mutzel. "Simple and Efficient Bilayer Cross Counting." Journal of Graph Algorithms and Applications. Vol.8 (2), 2004, pp. 179–194.
[4] Brandes, U., and B. Koepf. "Fast and Simple Horizontal Coordinate Assignment." LNCS. Vol. 2265, 2002, pp. 31–44.
[5] Y. Koren. "Drawing Graphs by Eigenvectors: Theory and Practice." Computers and Mathematics with Applications. Vol. 49, 2005, pp. 1867–1888.