Changing Text Properties
This example shows how to get properties of text in MATLAB® and change text property values to customize your plot.
Text Objects
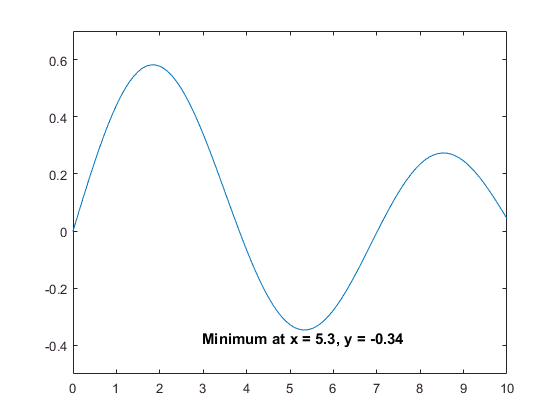
The text function creates a text object. For example, you can plot the Bessel function and place text in the plot at the minimum value.
Like all graphics objects, text objects have properties that you can view and modify. These properties have default values. The display of the text object, tx, shows the most commonly used text properties, such as String, FontSize, and Color.
x = 0:0.1:10;
y = besselj(1, x);

figure
plot(x, y)
ylim([-0.5 0.7])

xmin = 5.3;      % x value at the minimum
ymin = -0.34;    % y value at the minimum
str = ['Minimum at x = ' num2str(xmin) ', y = ' num2str(ymin)];
tx = text(xmin, ymin, str)
tx =
  Text (Minimum at x = 5.3, y = -0.34) with properties:

                 String: 'Minimum at x = 5.3, y = -0.34'
               FontSize: 10
             FontWeight: 'normal'
               FontName: 'Helvetica'
                  Color: [0 0 0]
    HorizontalAlignment: 'left'
               Position: [5.3000 -0.3400 0]
                  Units: 'data'

  Show all properties

Get Individual Text Properties
To access individual properties, use dot notation syntax object.PropertyName. For example, return the FontSize property of the text.
tx.FontSize
ans = 10
Change Text Properties
To customize the look of your text, change property values using dot notation.
tx.HorizontalAlignment = 'center';    % set horizontal alignment to center
tx.VerticalAlignment = 'top';         % set vertical alignment to top
tx.FontSize = 11;                     % make the text larger
tx.FontWeight = 'bold';               % make the text bold
Create Axes Text Objects
When you create a graph with a title or axis labels, MATLAB will create text objects for you.
xlabel('x')
ylabel('B_1(x)')
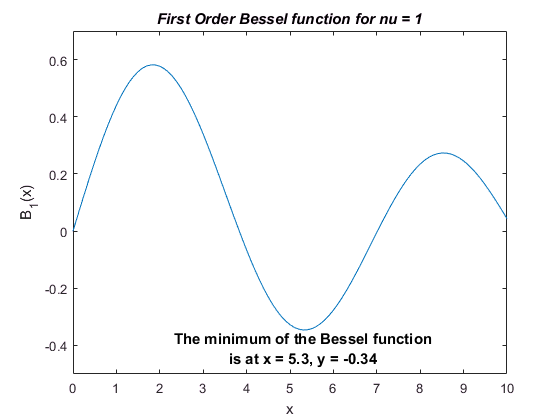
title('First Order Bessel function for nu = 1');Plot titles and axes labels are stored in the Title, XLabel, and YLabel properties of the axes. Get the plot title using the Title property of the axes. Then you can set the text properties for the title using dot notation.
ax = gca;                    % get the current axis
ttl = ax.Title;              % get the title text object
ttl.FontAngle = 'italic';    % set the font to italic
Use Multiline Text
To split the text into two lines, insert a carriage return character (char(10)) into the text.
tx.String = ['The minimum of the Bessel function' char(10) ...
  'is at x = ' num2str(xmin) ', y = ' num2str(ymin)];
Get All Text Properties
Graphics objects in MATLAB have many properties. To see all the properties of a text object, use the get command.
get(tx)
BackgroundColor: 'none' BeingDeleted: 'off' BusyAction: 'queue' ButtonDownFcn: '' Children: [0×0 GraphicsPlaceholder] Clipping: 'off' Color: [0 0 0] CreateFcn: '' DeleteFcn: '' EdgeColor: 'none' Editing: 'off' Extent: [2.7194 -0.4380 5.1613 0.0980] FontAngle: 'normal' FontName: 'Helvetica' FontSize: 11 FontSmoothing: 'on' FontUnits: 'points' FontWeight: 'bold' HandleVisibility: 'on' HitTest: 'on' HorizontalAlignment: 'center' Interpreter: 'tex' Interruptible: 'on' LineStyle: '-' LineWidth: 0.5000 Margin: 3 Parent: [1×1 Axes] PickableParts: 'visible' Position: [5.3000 -0.3400 0] Rotation: 0 Selected: 'off' SelectionHighlight: 'on' String: {2×1 cell} Tag: '' Type: 'text' UIContextMenu: [0×0 GraphicsPlaceholder] Units: 'data' UserData: [] VerticalAlignment: 'top' Visible: 'on'